
Stable Carbon and Nitrogen Isotope Analysis
It is these differences in atomic weights that provide unique signatures that can be measured by mass spectrometry.
The two elements used in organic stable isotope analysis at 14CHRONO are carbon and nitrogen. Carbon mainly exists as the carbon-12 isotope, but a small fraction is present as the carbon-13 isotope. Nitrogen mainly exists as the nitrogen-14 isotope with the smaller fraction of nitrogen-15 (0.4%) also present. The ratio of 13C/12C and 15N/14N in an organic sample will vary depending on the biosynthetic processes that have occurred. These ratios, R (sample), are generally expressed in relation to a known standard, R (standard) as δ13C or δ15N ‰ (per ml):

Applications
Photosynthesising organisms take up 12C in preference to 13C, so organic matter produced by photosynthesis is enriched in 12C and depleted in 13C relative to the inorganic carbon in the atmosphere and hydrosphere.
Similarly, the lighter 14N isotope is preferentially taken up by photosynthesising organisms, leaving behind the heavier 15N. Therefore, the δ15N value of sediments is lower when nitrate is plentiful in the environment. This “fractionation” effect can allow partition of source materials according to their stable isotope values.
Environmental analysis
The analysis of stable carbon and nitrogen isotopes can be used for research into past environments, as proxies for climate and habitat, as well as for modern environmental studies. They can also be used with modern material with diverse applications such as identifying anthropogenic impacts on freshwater ecosystems.
Dietary analysis
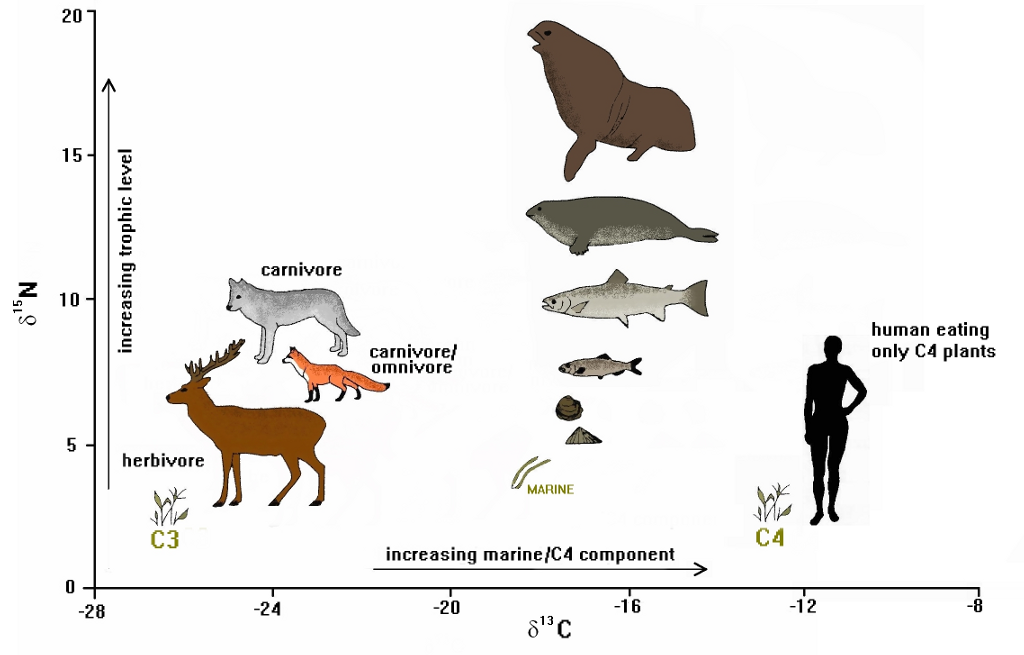
Stable isotope analysis is also a powerful tool used to identify dietary sources in archaeological contexts. Carbon (δ14C) stable isotope analysis is used to estimate the proportions of C3 (most plants) versus C4 plants (maize, cane sugar, certain millets, chenopods, sorghums and amaranths) and to distinguish between the consumption of marine versus terrestrial organisms in an individual’s diet.
C3 plants have δ13C values averaging about -26.5‰, while values for C4 species average about -12.5‰. The bone collagen from herbivores that subsist only on C3 grasses will give a value for δ13C of ca. -21.5‰. If the diet were based only on C4 grasses then the value would be ca. -7.5‰. If a modern individual consumes both C3 and C4 species, the δ13C value for its collagen will lie somewhere between -21.5 and -7.5‰. The δ13C values of marine plants usually lie in an intermediate position between the values of terrestrial C3 and C4 plants, depending on their carbon sources. Therefore, marine fauna usually have carbon isotopic values that are less negative than those of terrestrial animals feeding on C3-based foods and more negative than those feeding on C4-based foods. Freshwater aquatic food-webs appear to have C3-like carbon isotopic compositions.
A small (approximately 0.5-2‰) enrichment for carbon isotopic values occurs in each trophic level in a food-chain. For example, if the δ13C value of bone collagen of a herbivore subsisting on C3 plants provides a value of ca. -21.5‰, then the collagen of a human consuming the meat of that herbivore will give a δ13C value of ca. -20.5‰.
Simplified summary of stable carbon and nitrogen values for terrestrial and marine ecosystems (values are for flesh; to convert to bone collagen values, 5‰ should be added to δ13C values; δ15N values are the same for flesh and bone.
(Dr Svetlana Svyatko: adapted from Schulting (1998), see Svetlana Svyatko.

Fig. 2. Stable isotope ratios of various human diets (after Schoeninger et al. 1983; Pollard 1993).
The nitrogen stable isotope (δ15N) analysis also identifies the trophic level of an individual. The consumer collagen usually displays δ15N ratios, which are about 3-5‰ greater than its diet.
This fractionation effect results in a ca. 3-5% increase in δ15N as an individual ascends each step of a food-chain. For example, the δ15N values of most modern plants are between 0 and 5‰. Therefore, the nitrogen isotopic values of populations that rely on terrestrial animal protein in their diet, would average from around 9‰. The nitrogen levels of a consumer will increase when relying more heavily on aquatic resources. The mixture of both terrestrial and marine (fish and mammals) food resources in the diet would typically reveal δ15N ratios of around 10‰; the highest δ15N ratios are usually expected from populations using aquatic sources as a main staple in the diet, because the food-chains in aquatic ecosystems are more extended than those of terrestrial ones. It should be noted that a number of non-dietary factors may influence the carbon and nitrogen isotopic ratios of individuals.
These include climatic and canopy effects for δ13C ratios and climatic, physiological, crop manuring and nursing effects for δ15N ratios.
Bone contamination analysis
The C:N value is one of the primary indications of the degree of preservation of bone protein (collagen) and/or contamination by soil organic substances.
According to van Klinken (1999, 691), the characteristic % C values of intact collagens are 34.8±8.8 (1σ) wt % C; the nitrogen content of intact collagen is between 11 and 16 wt %. The recommended values for C:N atomic values are between 2.9 – 3.5 (calculated by dividing the percent of carbon by the percent of nitrogen in the bone and multiplying the number by 14/12, due to the different atomic weight of these elements).
Sometimes excess salts remaining in the collagen after extraction make %C appear lower, however this should not change the isotopic composition of the collagen. Higher values of %C may indicate the contamination from soil organic carbon. If C:N ratios are higher than 3.5 then the δ13C may point to the source of excess carbon, i.e. contamination from humic acids in the soil will tend to produce more negative values (less than -24‰).
Overview of C and N mass spectrometry at 14CHRONO
The trajectory of electrically charged ions moving through an externally imposed electrical and/or magnetic field is controlled by their atomic masses. This can be used to separate charged particles of different masses.
After samples are weighed and enclosed in tin capsules, they are combusted and measured in a a Sercon HS20-22 Continuous Flow Isotope Ratio Mass Spectrometer and accompanying Sercon PyroEarth Elemental Analyser. The sample is vaporised in a a ‘flash’ combustion of up to 1800⁰C producing CO2, N2, H2O, O2 and NOx gases. The gases are purified so that only elemental CO2 and N2 continue to a gas chromatographic (GC) separation column. magnetic/electrostatic deflection system separates the charged ions. The sample is vaporised in a a ‘flash’ combustion of up to 1800⁰C producing CO2, N2, H2O, O2 and NOx gases.
A ‘repeller’ plate inside the machine carries a low positive potential and accelerates the positive sample gas ions via a series of focusing plates and slits to the next part of the system. The ions will follow different paths according to their mass-to-charge ratio (m/z) and therefore gas species of different masses can be separated before being measured on the collector.
The ion collector measures the current flowing in a selected beam. This detector is a sensitive charge collector (e.g. Faraday cup). The ions strike the detector. Electrons ‘jump’ from the metal to neutralise the positive charge leading to an electron shuffle and hence a current which can be amplified and recorded. This is passed to earth via a large resistor where the voltage developed is measured.
This voltage is directly related to the number of ions being received at the detector. Masses 28, 29 and 30 are recorded for N2; and masses 44, 45 and 46 for CO2.